March 8, 2008

Transportation- High Speed Rail


High Speed TGV
France

Eleonore de Lusignan


Why the TGV?

-High speed rail has been a really successful form of transportation, progressively
uniting many European metropolitan conglomerates.

- At speeds above 200 mph it is significantly more efficient then commuting or traveling by car.

- Considerable time savings are obtained by using the TGV compared to air travel in that it connects between city center to city center.

How it works?

The TGV is a fully electric operational train that has been perfected over 25 years. The components that make the TGV trainset possible are its specially designed high-speed lines with not sharp curves, high powered electric motors, and a low axle weight. TGV trainsets travel at up to 200 mph in commercial use. Recently, the SNCF came out with the fastest high speed rail, TGV-Est in July 2007. Now Paris is only 2h20min away from Strasbourg (4hrs previously), and less then 4hours away from Francfort (previously 6h15min.) The SNCF is leading the way to connect all of Europe together by 2020.


Benefits

Here are a few comparisons:

Speed: --------------RECORD---------- AVERAGE


TGV (FR) ------------357 mph----------- 200 mph

EUROSTAR (UK) ------------------------186 mph

SHINKANSEN (JP)-- 277mph -----------164 mph

ICE (GER) -----------255 mph---------- 125 mph

AMTRAK (USA)---- 150 mph------------ 75 mph


Similar Implementations:


Shinkansen High Speed “Bullet Train”

Speed Record 443 km/h or 277mph
Best average speed 262km/h or 164mph

Between Hiroshima and Kokura the bullet train covers the 192km or 120mile distance in only 44 minutes. It averages a speed of 262km/h or 164mph which is the fastest scheduled train service in the world.


The Eurostar high speed train’s primary purpose is to connect London and Kent in Great Britain with Paris and Lille in France, and Brussels in Belgium. It is a sub company to the SNCF TGV, with a design more geared to the cross-chanel link. Its normal operating speed is at 186 mph, however when during the Chanel Tunnel it runs at 100mph. At 18 carriages it can hold 750 passengers

Nothing as exemplementary has been established in the United States how ever several Proposals have been in development for California, the North- East, and Midwest regions

March 4, 2008

Transportation- Policy, Clinton Foundation


Clinton Foundation
Emily Vernon

Why the Clinton Foundation?
  • Brings together resources and individuals to concentrate the efforts around a certain area or problem. It acts as a catalyst.
  • The ideas of reducing greenhouse gases and improving efficiencies are framed under a business approach.
  • Overall goal is to see action and progression with such topics. Its compiling of numerous websites is a good source for inspiration.
  • The collaborative nature is an important feature for it illustrates that this is a group effort across many different fields.


  • Key Facts: Works with partnerships between organizations, corporations, government, and individuals; Volunteers; Areas of work: health security, economic empowerment, leadership development, climate change, and racial, ethnic, and religious agreement;Specific initiatives: HIV/AIDS, Global, Climate, Hunter Development, Economic Opportunity

    Mission Statement:

    To strengthen the capacity of people in the United States and throughout the world to meet the challenges of global interdependence.

    Initiatives:

    Under certain initiatives, the foundation addresses the subject of transportation.

    A. Clinton Global Initiative (CGI)/Member Commitments

    For this part of the organization, members at the Annual Meeting make a commitment to complete a particular project. Listed below are a couple of commitments.

    1. SmartTransportation.org and Clean Air Taxi Initiatives, 2005

    A project of the Hidary Foundation to create incentives for cities to use more fuel efficient vehicles for taxi services.

    2. Unclog NYC Street and Clean Air, 2006:

    The Environmental Defense is aiming to reduce traffic congestion and air pollution in NYC through congestion pricing.

    3. Increasing E85 Capable Vehicles, 2005

    General Motors Corporation has set the standard to increase the number of motor vehicles that can operate on E85 fuel in order to increase the use of renewable resources in vehicles.

    B. Clinton Climate Initiative (CCI)

    Seeks to use a business approach when addressing climate change in large cities. This will be done by creating a pool of cities to buy energy efficient products at lower prices, motivate the experts to help create and develop programs to reduce greenhouse gas emissions, and create a standard and tool for other cities to work off of as well as share information.

    1. Climate Summit, May 2007, Highlights

    Panel focused on Urban Transit Alternatives and analyzed the cost, benefits, types of fuel, and set to help participant make better choices to manage these systems.

    2. www.c40cities.org

    The website for the climate leadership group, which provides information, solutions, and resources for cities.


    Sources
    www.clintonfoundation.org

    Transportation- Policy, Environmental Defense


    Environmental Defense
    Emily Vernon

    Why Environmental Defense?

  • The Environmental Defense is a unique organization due to their ability to link industry, science, and local efforts.
  • They take a dynamic approach to the idea of transportation, focusing not only on the impact on the environment, but its affect on health and economics.
  • Their ability to work across the board and their firm establishment makes the Environmental Defense an important player in the development of environmental, and specifically, transportation policy.


  • Key Facts: Nonprofit, Multidiscipline/Collaborative, Nonpartisan, American, Areas of Concentration: Global Warming; Land, Water and Wildlife; Oceans; Health

    Past Significant Projects/Transportation:

    A.Corporate Partnerships/ Cutting Corporations’ Greenhouse Gas Emissions

    Collaborated with seven of the world’s largest corporations, including BP and DuPont, to cut pollution and meet international reduction targets while increasing revenue. Also worked with Fedex to reduce fuel usage and emissions through the introduction of a new hybrid-electric delivery truck.

    B. Health/Lead Banned from Gasoline

    Convinced regulator in 1985 to ban the use of lead in gasoline after demonstrating the affects of lead on children. This drastically reduced blood lead levels.

    Current Recommendations/Policies:

    1.Cut Pollution from American Cars:

    American cars emit over 333 million tons of carbon dioxide a year. Though we are only 5 percent of the world’s population, we own 30 percent of the world’s cars and emit 48 percent of the worlds CO2 emission from automobiles.

    Goals:

    • Pressure auto industry to support national global warming policy
    • Educate car owners about reducing emissions
    • Explore ways to improve fuel efficiency and reduce pollution

    2. Clean Cars Law

    California has always been a leader in automobile regulations. In 2002, it created the Clean Cars Law to reduce tailpipe emissions. Though many states have chosen to adopt California’s measures, opposition from the automobile industry and EPA has made getting the required wavier for the law impossible. The Environmental Defense teamed up with four other non-profits in December of 2007 to fill a lawsuit challenging the EPA decisions.

    3. Cleaner Emissions School Buses

    Diesel emissions are a risk to children’s health, however 24 children are exposed to these emission by the bus they ride to school. The Defense is leading the way to clean up children’s school buses in a practical and sustainable fashion. Four steps were presented, replace, retrofit, reduce idling, and routing. Cities such as Houston, Boston, and Atlanta are joining in this campaign.

    4. Congestion Pricing/New York City

    Over the next 25 years, it is predicted that New York’s population will grow by about 25 million people, however the city’s transit system in its current state will be overwhelmed by this growth unless action is administered, It is suggested that congestion pricing is a viable solution across the board for it is a fair solution that is good for business, health, the environment, and the revenue could be used to improve the deteriorating public transport system for the public.

    5. Taking on the Challenge of Growing Urban Areas

    The Environmental Defense Agency is tackling the idea of transportation from a variety of angles, including urban development. They are working with local groups and officials to create viable market solutions to cut congestion, clean the air, and promote green development.

    a.Cut Congestion with Congestion Pricing

    b.Clean the air by planning to replace public fleets, taxis and buses, with hybrids and/or retrofitting diesels with filters as well as enact anti-idling laws.

    c. Promote green development to illustrate is economic value and create innovative incentives.


    Sources
    www.edf.org

    March 3, 2008

    Transportation- Curitiba Growth

    Curitiba is the capital of Parana state, in southeastern Brazil. Following the country’s demographic pattern, it faced explosive urban growth from the 1950s onward. Although the intensity of development decreased somewhat during the 1990s, especially within the city’s borders, data from the 2000 Census indicated that Curitiba was then the core of a 2.5 million inhabitants metropolis.

    Several trends indicated a tendency for uncontrolled growth and the well-known social and environmental negative impacts of rapid urbanization. The city has been acknowledged by the international media, experts and development institutions as a successful example of urban environmental management and social development. Within this process Jaime Lerner, three times mayor of Curitiba, was a key player.

    The urban revolution that has made the city a national and internatinal reference in Urban Planning focused mainly in public transportation, environmental and social programs and urban design.

    Since his first term in office (1971-1975), there was a conscious decision to take control of the city’s urban growth process by using two basic means: land use legislation in combination with the right to determine public transport routes. Total priority was given to public transportation throughout the entire city and to pedestrians in the Central Area. City authorities began to implement the urban design structure that counterbalanced urban sprawl and emphasized linea growth along five pre-determined structural axes. Land use legislation was enacted to guide this growth, allowing for higher housing densities in streets served by public transport.

    The plan was transparently shared with the population, contributing to avoid land speculation. It is also important to note that this design helped provide mobility to all strata of society, from higher income households to lower income settlements located in the outskirts. A “social fare” was also encouraged, for the people who live closer to the downtown area pay the same flat fare as the lower-income users who board the buses in the periphery.

    Curitiba’s planned road network and public transport system are probably the most influential elements accounting for the present shape of the city. The high priority given to pedestrian areas and public transport led, in time, to the creation of the world’s first bus-based Mass Transport Network, including the “tube” stations and the 25 meter bus units which operate as a Metro with all the new design, institutional and operational work needed to implement his completely new concept. At the same time, the land use plans as adopted by both the city and the building industry helped to create a thriving economic environment and attract new investment to the city and state. All this was achieved respecting green areas and environmental issues, giving the city a world-renowned reputation for a high standard of living.

    Transportation- Bus Transit System


    Bus System
    Curitiba, Brazil
    Jenny Wu

    Why a Bus System?

    xxx

    How It Works
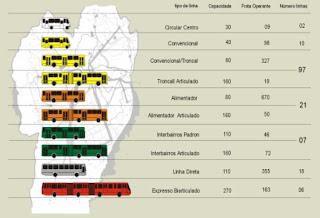
    A central lane is set aside for buses only along the main axes of the city. New bus lines were created and expanded as the city grew. The transport system is down as the Integrated transport Network (ITN). In the ITN, all lines intercommunicated, allowing connections in up to four different directions at each transfer point for one flat fare. The ITN now covers nearly 800 kilometers and provides service for one million trips daily. The structural axes now cover 56 kilometers of roads exclusively devoted to express bus traffic. These roads are complemented by 300 kilometers of feeder lines, 185 kilometers of inter-district lines, and 250 kilometers of direct lines.

    Speed: The conventional system operates at 20 kilometers per hour on exclusive lanes, and the direct system reaches an average speed of 30 kilometers per hour.
    Buses are color-coded: the express buses are red, inter-district buses are green, and the conventional (feeder) buses are orange and yellow.
    Ease of transfer: A key feature of the ITN is the ease with which passenger can transfer, for a single fare. Direct bus systems have fewer stops than an express bus and runs on the one-way routes of the central roads on the structural axes.
    Pre-pay and high boarding platforms: Passengers pay before boarding in a circular tube platform which is raised to be the same height of the bus floors. This greatly reduces boarding and unloading times.
    “Boarding tubes”: These “boarding tubes” can carry three times as many passengers per hour as a conventional bus operating at street level.

    Benefits
    Uses less fuel- saves 27 million liters of fuel annually
    Prevent more cars from adding to congestion and traffic- reduction of 27 million auto trips per year
    Reduces pollution
    Efficient, reliable, and faster
    Serves 1.3 million passengers
    Saves money- only 10% of income, much lower than national average
    Improved social interaction while economically advantageous

    Implementation in Other Cities

    xxx

    Sources

    xxx

    Transportation - Congestion Pricing


    Congestion Pricing
    London, New York City + Milan
    Mary Banas

    Why Congestion Pricing?
    Before the scheme was introduced in 2003 the average speed of traffic moving through central London had fallen to below 3mph. Traffic flow has now increased to just below 10mph.

    As well as helping traffic flow the congestion charge also aims to improve the bus network, and make central London a more pleasant location for residents, visitors and businesses.

    In every case where it has been implemented (London, Stockholm, and Singapore), congestion pricing has been successful at reducing traffic both within the “congestion zone” and outside it, speeding bus service, decreasing delivery times, improving air quality, and cutting greenhouse gas emissions, with no material impact on the economy, including retail activity in the zone in which the charge applies.

    LONDON
    Since February 2003 the city of London has charged a fee
    for driving private automobiles in its central area during
    weekdays as a way to reduce traffic congestion and raise
    revenues to fund transport improvements.

    Benefits
    + significantly reduced traffic congestion
    + improved bus and taxi service
    + generates substantial revenues
    + public acceptance has grown
    + support to expand to other areas of London
    + London is model for other cities

    How It Works
    Motorists driving in central London on weekdays between 7:00 am and 6:30 pm are required to pay £5, increasing to £8 in July 2005. The charging area is indicated by roadside signs and symbols painted on the roadway. The scheme is policed by cameras on roads within the congestion zone which read car registration plates.

    Drivers pay £8 per day by:
    + telephone
    + text message
    + mail
    + internet
    + in person at a retail outlet

    It is also possible to pay up to midnight the day after travel, although the charge is then increased to £10. Drivers are able to purchase daily, weekly, monthly or annual passes. There are discounts for buying in advance.

    NEW YORK CITY


    New York City has a long-term transportation plan that includes Congestion Pricing for the Central Business District (CBD).

    On a given workday, the Manhattan CBD is home to nearly 2 million workers from around the region, hundreds of thousands of tourists, and several hundred thousand residents. Cars compete for the road with buses, trucks pedestrians, cyclists and taxis.

    Vehicles trapped in traffic spew pollution into the air, putting the health of those living near congested roads at risk; and the resulting jams cost the region more than $13 billion dollars every year.

    As our population grows by another 900,000 people, we add more than
    20 million visitors annually, and 750,000 new jobs—many concentrated in the CBD—the consequences of congestion will become ever more severe.

    Implementation in Other Cities
    Implementation requires a suitable combination of travel and political conditions, including widely dispersed benefits and the ability to overcome public skepticism. Compared with other cities London has a particularly small portion of automobile commuters, and many of them reside outside the city. As a result, a relatively large portion of voters perceive direct benefits from the fee. Voters in other cities may be more skeptical of such benefits.

    Sources
    BBC Guide to the Congestion Charge
    Victoria Transport Policy Institute
    Plan NYC 2030 (click on the Transportation PDF)

    ECO PASS
    MILAN

    The city of Milan, Italy has launched a one-year trial of EcoPass—a scheme of graduated emissions-based charges for entry into Milan’s Limited Traffic Zone (Zona a Traffico Limitato, ZTL).

    The EcoPass charges of up to €10(US$14.70) per day are calculated based on the Euro emissions class of the vehicle, the fuel type, the presence of approved filters, and the type of transport (personal or goods).

    In addition to the daily access EcoPass card, Milan is offering a multiple access card (50 days of access, not consecutive, with a reduced price) and an annual subscription card for residents of the ZTL.

    The ZTL is bounded by 43 gates equipped with electronic camera which record the passage of the vehicles, and debit the card holder’s account appropriately.

    Results for Milan

    First of all, traffic figures are down by 22.7 percent, or by 26.7 percent if you exclude public transport vehicles (buses and taxis). This had the side benefit of increasing the average speed of the vehicles that do remain by 11.3 percent. The figures for the subway train lines (Metropolitana) went also up, with more people (9.1 percent more) using it to access the city center.

    The highest reduction in car usage came from the most polluting cars (those under the Euro I, II and III norms), which have to face higher prices to access the zone: the number of these cars dropped by 40 percent.

    Maybe the most remarkable figure is the measurement of the quantity of certain pollutants. Pm10 (particulates under 10 micrograms) were down by 26 percent, NOx was down by 21 percent and ammonia by 40 percent.

    Sources
    Green Car Congress blog
    Auto Blog Green


    Transportation - Problem Statement

    “Transportation accounts for 33% of all US CO2 emissions. Driving our cars is the most significant way we as individuals produce CO2 emissions…Changing your light bulbs to compact fluorescents is a good thing, and we all should do it, but reducing the CO2 output from your tailpipe is the single most important thing you can do as a consumer.”
    (Robin Chase, Founder of Goloco & Zipcar)

    Posting Instructions

    Hi all,

    please post your research in the transportation topic area over the next few days...

    the title should read: Transportation - Your Topic Here

    Opening Image

    Name
    Location
    Your Name

    Why your Topic?

    How it Works?

    Benefits?

    Implementation in Other Cities?

    Sources?

    Link to the ppt.

    Add images as you see fit in the text and and please label the post transportation